You want to invest in crypto and get some juicy gains, and you have a list of altcoins you are interested in.
You did fundamental research, and you know that these coins are checking all the boxes:
- Fundamentals
- Roadmap and Developers
- Trading volume
- The purchasing methods
- The social activity
Now it’s time to do a macro technical analysis. We do this to avoid loss and get a rough idea of when to start dollar cost averaging to get massive gains in the bull run.
Today I want to show you my 5 steps for macro technical analysis. I am going to do this by an example. My example is the coin Moonbeam (GLMR). This coin is a smart contract para chain between Polkadot (DOT) and Ethereum (ETH). I did fundamental research and expected this coin to succeed in the next bull run.
TA is a big subject in Crypto, and I can’t give you all the information at once. So I will focus on the basic stuff that gets the job done.
Oke, let’s go.
1. Select a time frame
We first start with selecting the right time frame (TF). Macro technical analysis is always done on a higher TF.
This is the monthly, weekly, and daily TF. A higher TF gives us a bird’s eye view of the price action. For example, each weekly candle has one week of price action. A daily candle gives us price action from one day.
The first price action of a candle and the last price action of a candle is called the body of the candle. The lines above and below are the high and low of the candle. Reading this information is the bare minimum for TA. This piece of information is very important because it tells us a lot. We can use the body of the candle to predict the price. We continue with this in step 3: identify key price levels.

2. Understand the market condition
The second step is to identify in what market we are. You need to do this. Because if you don’t, the market will humble you, and you will lose a lot of money. The price can drop even more if you buy at a low in the bear market. And with a bull market, you can wait forever if you want the price to get lower.
There are three types of price movement we want to recognize:
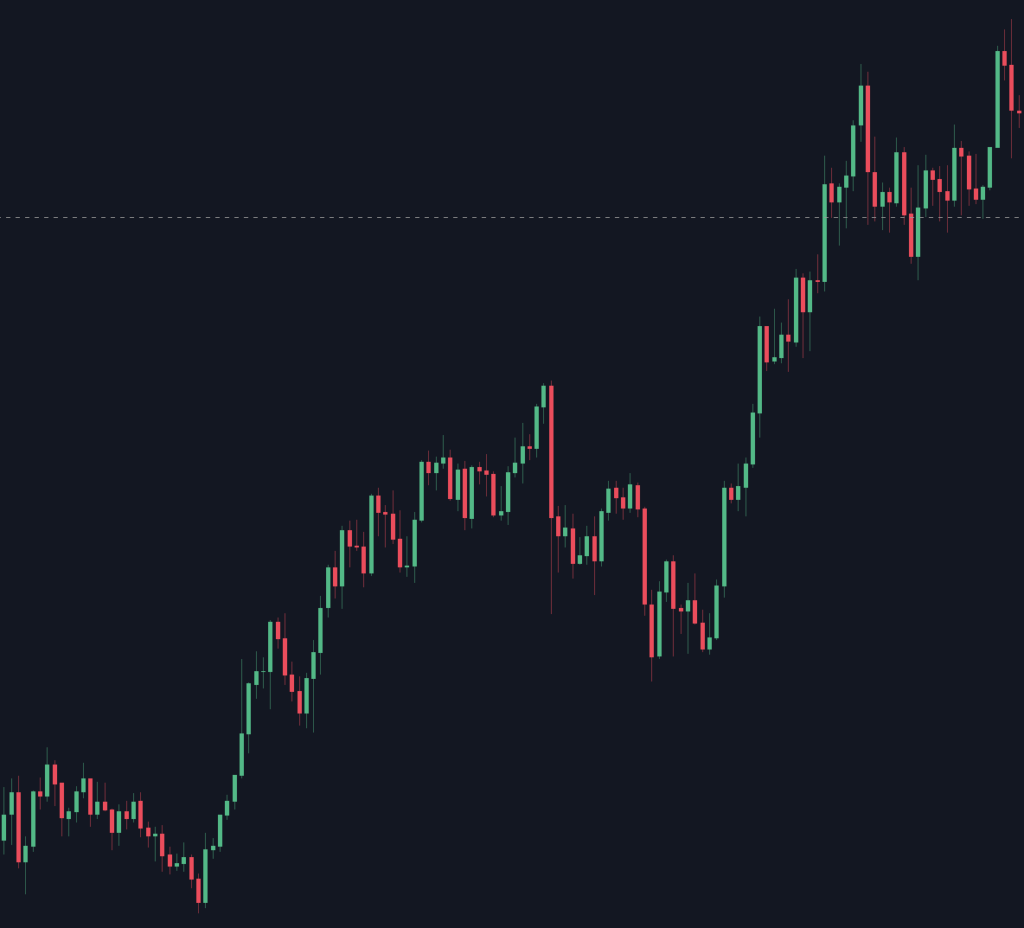
- Bull market: Highs are getting higher
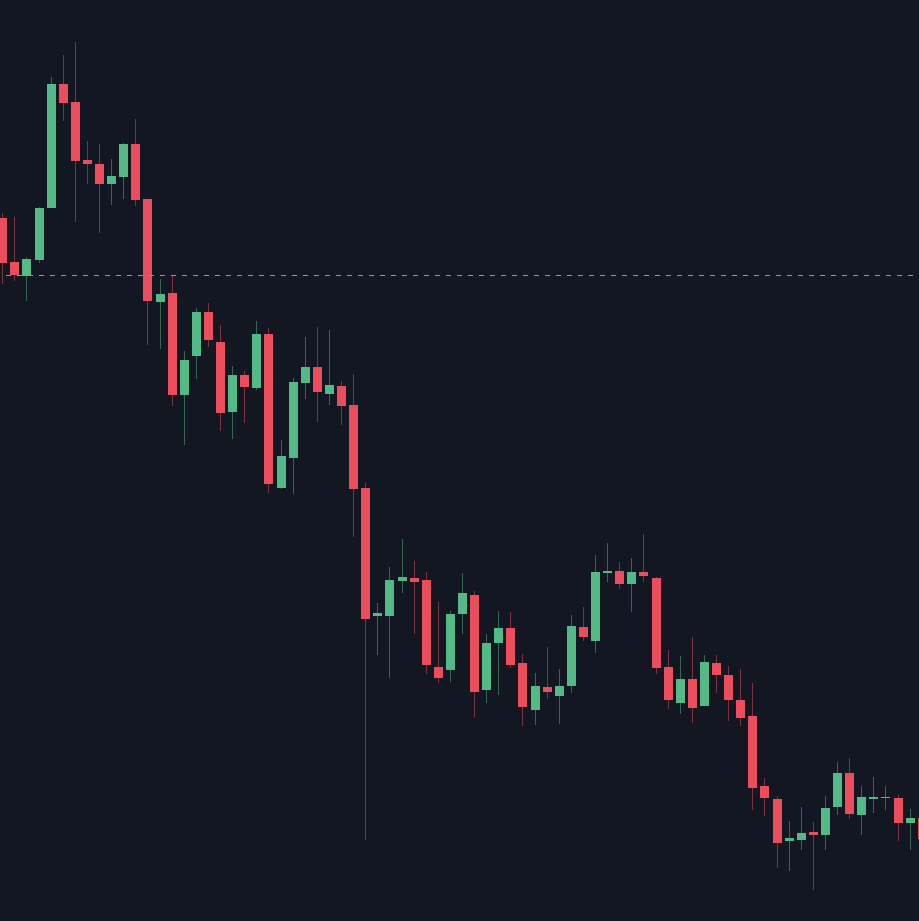
- Bear market: Lows are getting lower
- Sideways market: the price has a clear high and low
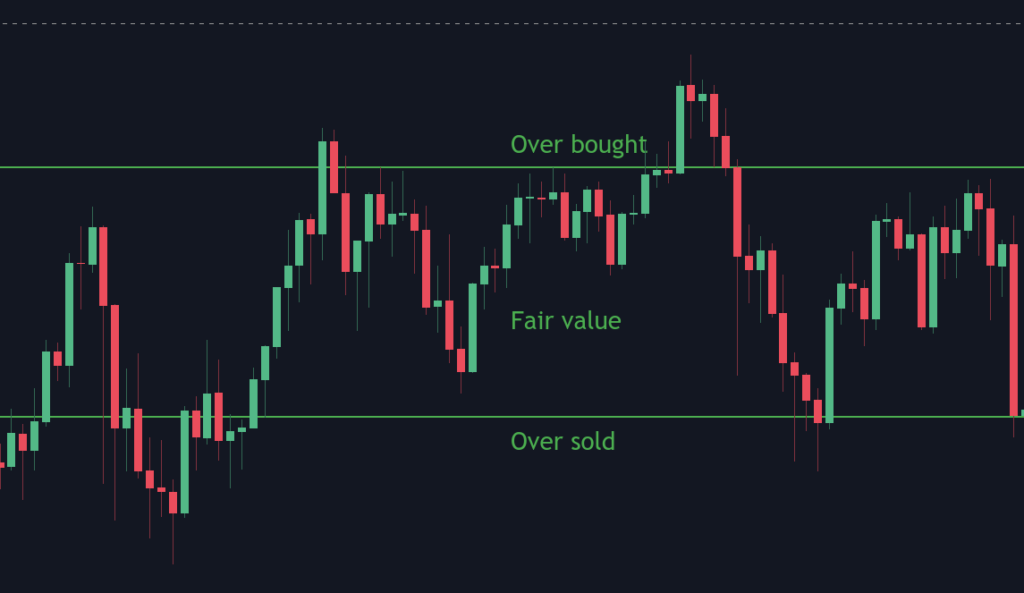
Go ahead and open Trading View and look up the coin you want to chart. Use a daily or weekly time frame and see if the highs are getting higher, the lows are getting lower, or the price is moving sideways.
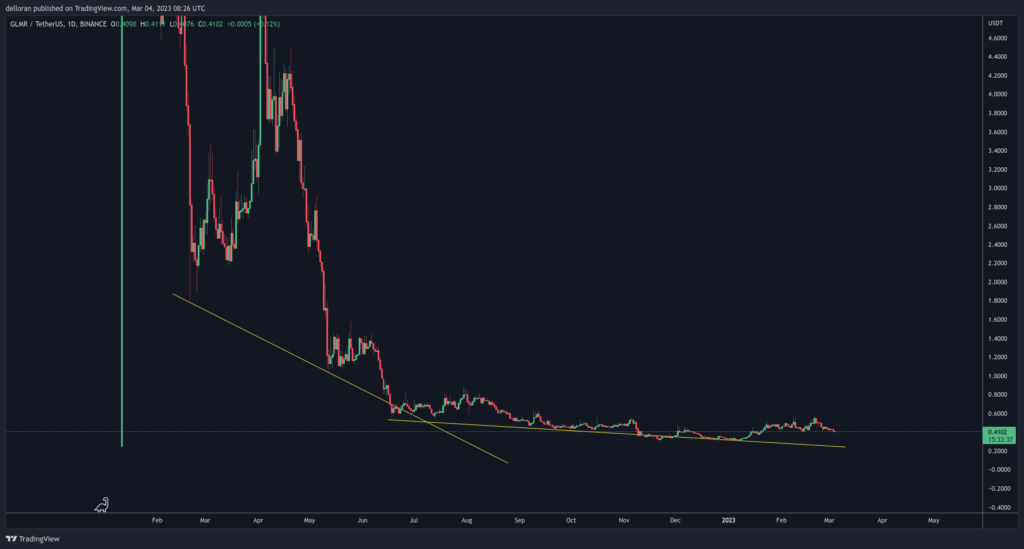
For example, GLMR is in a bear market. The lows are getting lower. But you also see that the price is moving towards a more sideways market. The coin is getting less volatile. The best moment to invest is in a coin that isn’t too volatile. You want to have clear support levels.
3. Identify key price levels
We now want to identify key price levels in crypto. You can start by analyzing the chart and looking at where the price bounced off a specific price. Support levels are prices the market has shown buying interest, while resistance levels are prices where selling interest has been strong.
You can define a weekly key price level by putting the TF on weekly and looking for at least two aligned body candles. See my GLMR example below:
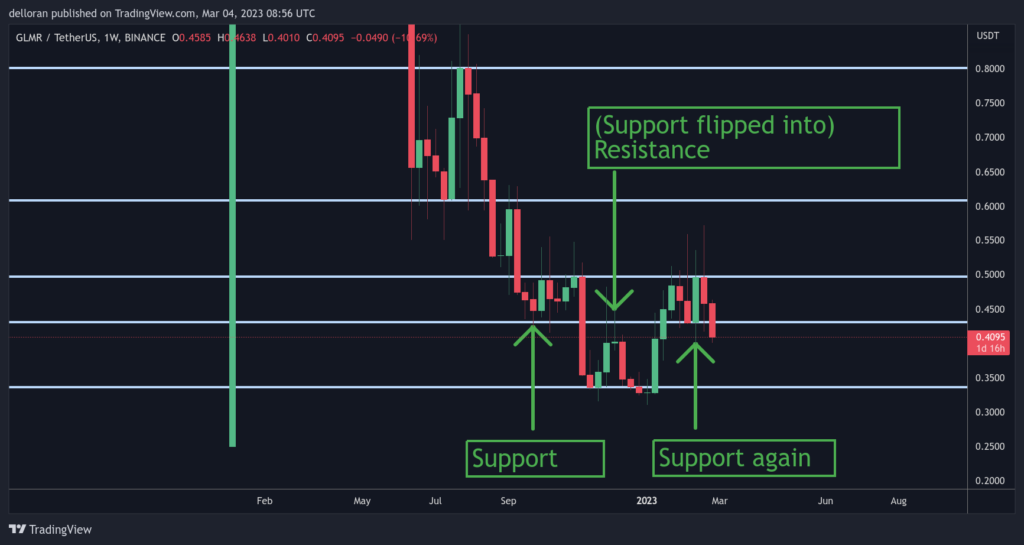
Weekly resistance is at $0.5. We see that the price increase stops at this point. We see two support levels at $0.43 and $0.335. The first time GLMR hit $0.43, it bounced, but after that, it fell to the next support level of $0.335. Then the price bounced and tested $0.43 as resistance. After that, it broke through $0.43, and now it’s finding support at the same level.
The most interesting points are:
- You can simply draw the levels on the chart.
- Price has a high probability of reacting on a weekly or daily level.
- Support can flip into resistance and resistance into support: flipping key levels is mostly caused by buying and selling pressure and, of course, by whales.
4. Understand the buying and selling pressure
When the price comes to a major level, will you just start buying?
Using a momentum oscillator is the best way to know when to buy. A momentum oscillator is a type of indicator that shows you the buying and selling pressure. The indicator I often use is the Relative Strength Index (RSI).
The RSI ranges from 0 to 100 and is typically plotted alongside the price chart. When the RSI is above 70, the market is overbought and may be due for a correction or reversal, while an RSI below 30 suggests oversold conditions and a potential buying opportunity.
We use the RSI on the daily or weekly TF. You can see if a crypto coin is oversold or overbought. Below is an example of the GLMR chart with RSI and the current (03/2023) price level.
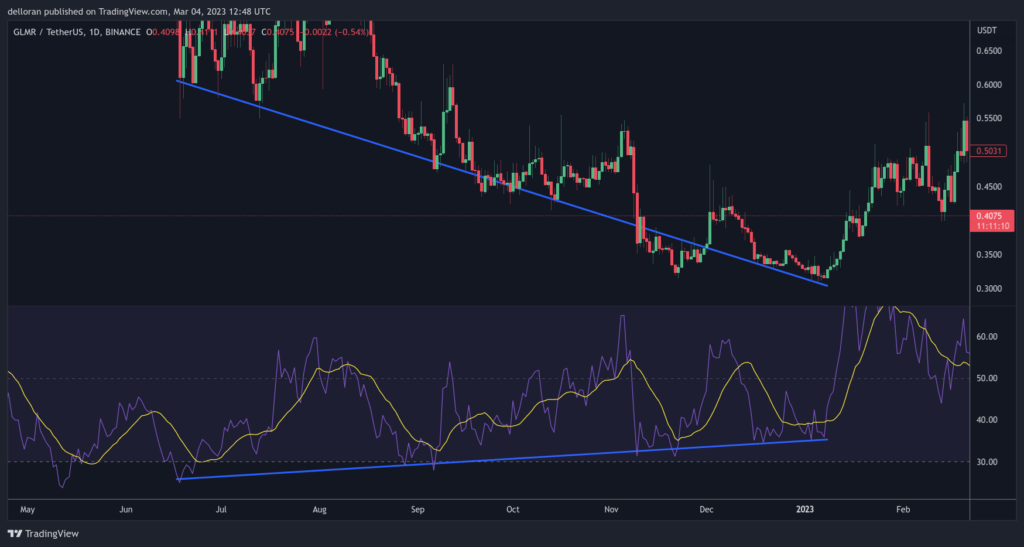
This is a great example because you see a divergence. The price is getting lower, but the buying pressure is getting higher. The price is dropping, but fewer people are selling the coin. A good and healthy crypto project won’t drop in price forever. There will be some bounce.
Key takeaways:
- Use RSI indication to see the buying and selling pressure
- Use the daily or weekly (for older coins)
- Look for divergences
- Bullish: Price goes lower, RSI momentum gets higher
- Bearish: Price goes higher, RSI momentum gets lower
5. Start investing when you see confluence
This part is where we put it all together. Combining multiple observations on the chart and creating an entry is called confluence. We want to know in what market condition we currently are. Put the weekly and daily levels on the chart. And after that, you want to look at the RSI for a divergence.
Bullish:
- Price is getting lower
- RSI is getting higher
- Price is coming to a major support level (Daily and weekly)
- Market condition:
- Bear market: Be careful. When considering an entry, the price should have dropped a lot with multiple bounces.
- Bull market: Price tends to put in higher high. So this is simply ‘Buying the dip.’
- Sideways market: Price is oversold in the range.
Bearish:
- Price is getting higher
- RSI is getting lower
- Price is coming to a major support level (Daily and weekly)
- Market condition:
- Bear market: Price tends to put in a lower low. So try to sell/short a temporary top.
- Bull market: Be careful. When considering an entry or take profit, the price should have reached all-time highs.
- Sideways market: Price is overbought in the range
In all the above cases, you need to use proper risk management. So you need to ask yourself, what are you willing to lose on the trade? And I recommend using a DCA strategy to average your entry. There is a big chance that you are wrong. You minimize the risk by averaging and spreading it over the years.
Let’s put it all together for GLMR:
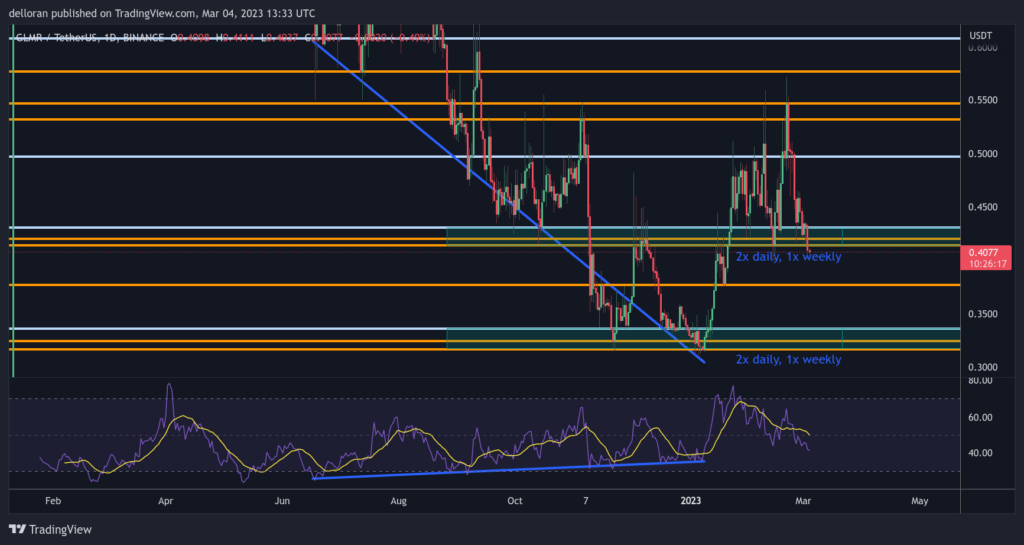
The above chart shows that the price is getting low, and the RSI is getting higher. I’ve put the daily (orange) and weekly (light blue) on the chart. Between $0.32 and $0.35, we have 2x daily and 1x weekly support.
This zone is an entry zone for me because the RSI looks oversold on higher time frames. And the price is coming to a major support zone. I recommend starting DCA in that zone. If we go above the zone, we need more confirmation to DCA into GLMR. For example, the daily retest of $0.37.
Doing macro TA is not set in stone. You can add confluences and triggers to enter trades and start DCA in a coin. I must say again that you need to make sure you use good risk management and that you can manage losses if a trade doesn’t go as planned.
Stay safe, and best of luck.
Daniel Donselaar

